- Trendlines
- Posts
- 📈 The One With Canada
📈 The One With Canada
We're cleaning up the cloud, vacationing in the mist, and embracing the autumn air
Welcome to Trendlines!
Well, would you look at that! Another boring, peaceful week in global news. The only recent headline that caught our attention is Pumpkin Spice Latte’s 20th birthday. We hope she’s celebrating in a heartwarming way, like reuniting with a long lost apple cider donut or setting up a GoFundMe for a jack-o-lantern to get a facelift. Speaking of heartwarming, here are the cozy activities we’re getting into this week:
Applying the Marie Kondo method to cloud storage.
Trying to wipe the maple syrup off our glasses long enough to go sightseeing in Canada.
Identifying which regions of the US are candy corn-less hellscapes.
Enjoy reading.
| Open Source |
The One With cloudfs
Like your friend who studied abroad for six months in the UK and insisted on using terms like “crisps,” “knackered,” and “loo,” for the next two years, we’re here to remind you Gradient is more than your friendly neighborhood newsletter producer: We’re also a market research firm leading with advanced statistical models to help powerful organizations make better strategic decisions.
We hope you aren’t knackered from hearing about those statistical models (did anyone say MaxDiff?), but we’re mixing things up to reveal what’s behind our data analysis curtain: The wizard responsible for our statistical models is code. Our data scientists work diligently on all client and Trendlines projects using the programming language R to ensure our clients get accurate insights and our readers (you!) can see a chart with lots of bars and numbers and understand the data it conveys.
Our data scientists are constantly identifying how we can speed up and simplify our coding pipeline. Take, for example, a simple Trendlines chart. First our data scientists must download the data from a secure Amazon S3 location. Then they write the code that will transform that data into a legible chart. Finally they produce and save the chart on Google Drive so the regular people (us. Especially those of us with liberal arts degrees) can download the image and place it in your newsletter. With Gradient’s latest code project, cloudfs, the days of that lengthy manual process are over. Developed by our data scientist Iaroslav, cloudfs is our first foray into open source code. The result is better, faster, stronger data.
cloudfs is a powerful R package designed to simplify cloud storage interactions. It offers a unified, easy interface for handling that storage and seamlessly integrates with Google Drive and Amazon S3. Instead of typing out redundant, duplicative code snippets to organize and store your data, cloudfs requires only a few flexible lines of code and voilà, your files on the cloud become as neat as a well-organized spreadsheet.

Are you looking for an easier way to interact with cloud storage systems while dabbling in R? Check out a more detailed blog post and take a peek at the source code. Happy coding!
Do you have an awesome Trendlines story idea we should know about? We want you to tell us about it!
| Gradient in the Wild |
The One With Canada 🍁
What do Nostradamus, a psychic hotline, and Gradient have in common? We’ve all accurately predicted the future anticipated cultural (or personal) shifts based on evidence. Founded as a fully remote, global company, Gradient was an outlier in pre-pandemic business operations, but whaddya know? In a post-2020 world we’re lean, efficient, and had the luxury of embracing Zoom, kids-and-pets-on-camera, and sweatpants long before other organizations. In fact, survey says 100% of us are wearing sweatpants right now.
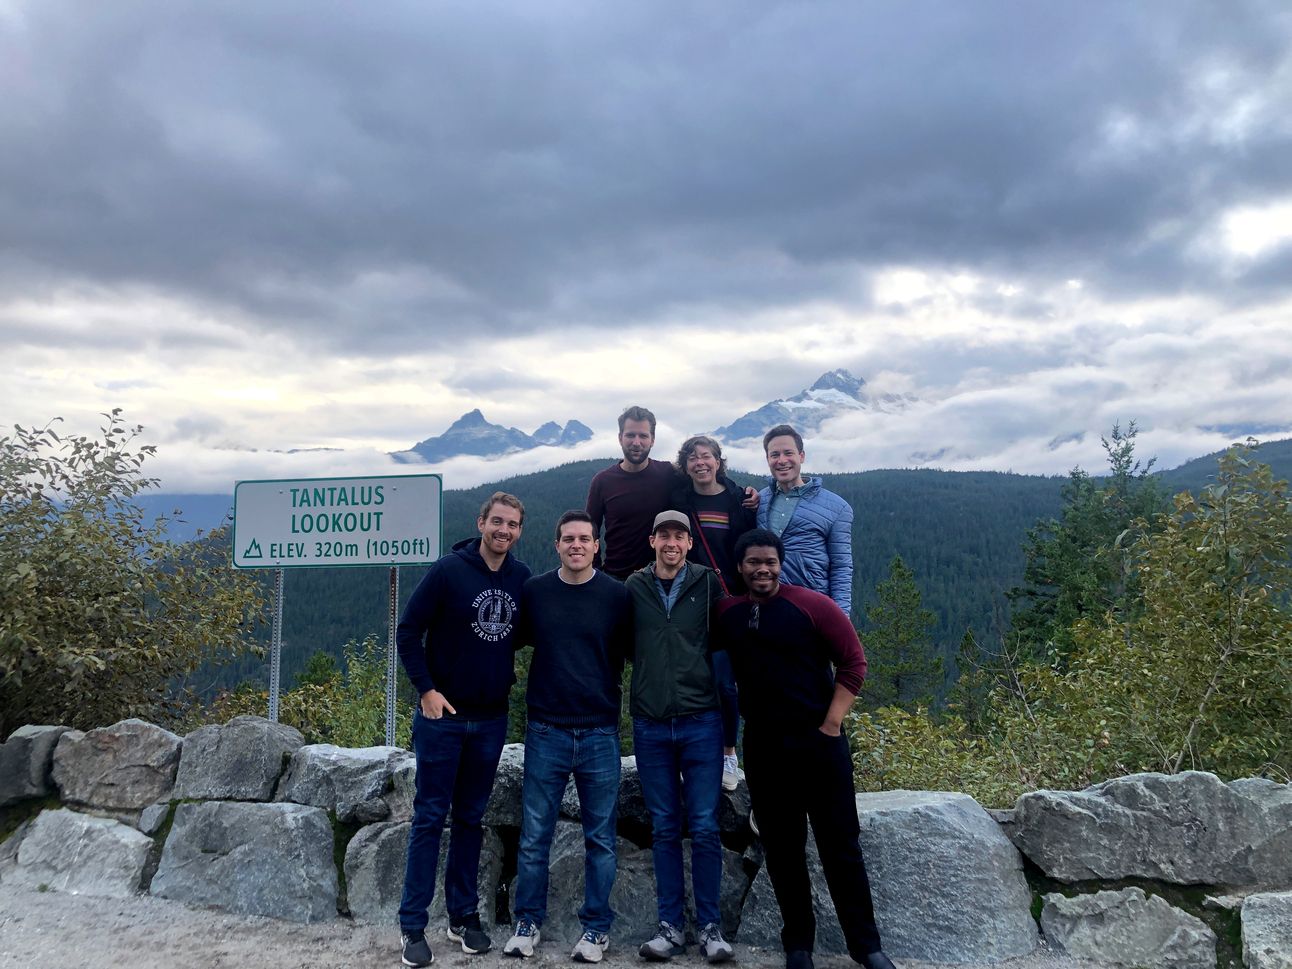
The team meets in person twice a year for face-to-face strategy sessions and watercooler conversations. Last week, a group of us ventured from as far as Amsterdam to gather in Vancouver, Canada. While we didn’t cross Canadian superstar Alanis Morissette off our celebrity bingo card, we marveled at Indigenous totem poles at the Bill Reid Gallery of Northwest Coast Art, ate poutine at Granville Island’s Public Market, and faced our fear of heights at the vertigo-inducing Capilano suspension bridge (isn’t it ironic, don’t you think?).
We also took 1,716 group photos where at least 29% of us had their eyes closed. Maybe next time we’ll hire a professional photographer, but it’s a Jagged Little Pill to swallow. Blame Canada!
| Holiday |
The One With the Pumpkin Spice Latte
Note: A year ago this week we published one of our most popular stories about America’s most popular season. Enjoy this blast from the past while you feel the crunch of leaves under your feet!
Fall is such a wonderful time of year, the typical Trendlines story intro will not do. No, fall deserves a song parody set to the tune of "My Favorite Things" from The Sound of Music:
🎶🎶🎶
Pumpkin spice everything, not just the coffee
Pies served with whipped cream and maybe a toffee
Scary ghouls and monsters, playing with my heart strings
These are a few of my favorite things
Sporting a plaid shirt beneath lots of layers
Watching football and basketball, seeing the players.
Eating gravy and turkey, giblets and wings
These are a few of my favorite things
🎶🎶🎶
Now that we have shared a few of our favorite things, what has Americans falling for fall?
First of fall, a plurality of Americans (44%) agree that fall is the best season. The rest are wrong. Strangely, Northeasterners are the least likely (38%) to choose fall as their favorite season—apparently, if you’ve seen one hectare of maple trees transition from emerald green to a golden yellow, you’ve seen them all. Southerners are the most excited about the season with 46% choosing it as their favorite season. Even if it only lasts about two weeks for them. #falsefall.
Americans’ favorite fall activities include enjoying nature (25%), celebrating Thanksgiving (19%), and watching sports (13%). Unsurprisingly, those living in the West are significantly less likely to enjoy fall nature (19%) compared to other regions. While coastal Westerners don’t get to experience the changes in leaf colors as much as others, they do get a reprieve from the summer heat, making wearing warm clothing their fourth favorite activity.

With all regions of the U.S. embracing the season, we should expect at least one politician to run on a “Fall 365” platform during the midterm elections. Now that is climate change we can get behind. Handing out pumpkin pies to voters would be a smart tactic given a plurality of Americans chose it as their favorite food (18%). However, if you want to win the South, it may be best to pass out turkey legs, as the succulent bird is the top treat for most Southerners (24%). As they say in the South, you can’t skin a pie!
Want to see the data? Curious about the methodology? Just reply to this email.
That’s a wrap, folks
We'd love to hear from you. Do you have any comments, suggestions, or other pieces of feedback? Please don't hesitate to respond to this email, we don't bite!
Do you have an idea for a research story? Want to see it in (digital) print? You can submit your own ideas for upcoming stories to our Trendlines idea repository.
Can't wait for more? Take a look at our public roadmap to see what's in store and vote on potential future Trendlines stories.
Do you know someone who’ll love this?
About Gradient
Gradient is a cross-functional team of industry analysts, market researchers, data scientists, technologists, and storytellers who help organizations uncover missed opportunities, find new layers of clarity, and pioneer new directions with confidence and statistical integrity. We work with startups, Fortune 100 brands, consulting firms, and political campaigns.
Join the conversation